From space, a better perspective on the place where we live.
We explore orbits, process Copernicus observations and build tools to understand the territory. FlowMind, Orbital Nexus and Relieva look at the same world from different angles.
The sensor records a certain type of signal, over an area and at a known time.
02
Data becomes accessible
The products are distributed through Copernicus Data Space Ecosystem.
03
FlowMind puts them in context
We choose the area and period, process the layer and compare it with other sources.
04
The team interprets
The visualisation supports the analysis. An important conclusion requires verification and context from the field.
Copernicus · the European Earth observation programme
Different sensors. Different questions.
We have integrations that access and process Copernicus data. Choose a mission to see what it observes and how we use the information in FlowMind.
Sentinel-2·Optic multispectral
More than a photograph.
The optical sensor observes light reflected from the surface in several spectral bands. In FlowMind we combine them for natural colour images, vegetation indices and water exploration.
The bands have different resolutions: 10, 20 or 60 m. Clouds and shadows can hide the ground. We choose suitable observations and periods.
Educational illustration. The real layers carry a source and a date.
We use data from the European Copernicus programme; the satellites are operated within it. Observations are not a continuous video stream and do not provide the same resolution for each layer. The animations on this page explain the mechanism, without representing real measurements.
Contains modified Copernicus Sentinel data (2026), processed through FlowMind. Requested interval: 15–31 August 2026.
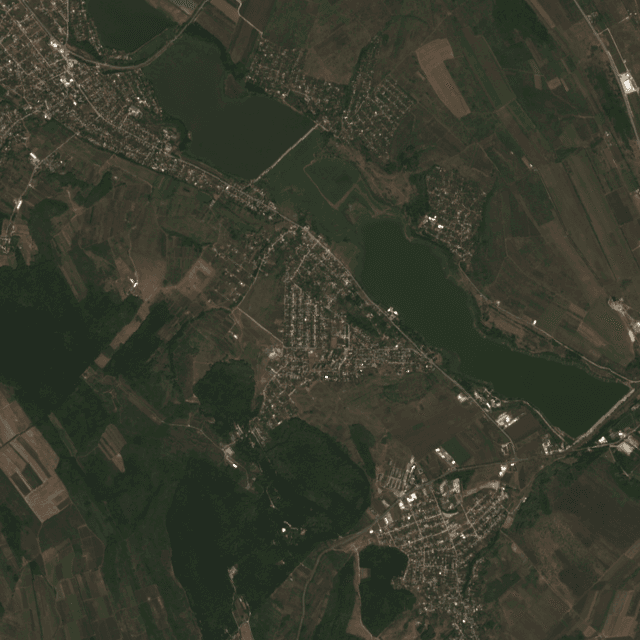
A real observation
The Dănceni area, seen by Sentinel-2.
This is a processed image from Copernicus data. You can distinguish agricultural plots and water, but a single image does not explain why an area changed.
For analysis, we select comparable periods, check cloud cover and combine the image with the appropriate indicators. The displayed interval is the period requested from the source, not a claim that all elements come from the same day.
An application for exploring orbits and passes across the sky. Positions are calculated from public orbital elements. You can understand trajectories and perspectives without confusing them with direct telemetry.
Optical, radar, thermal and atmospheric layers. We select the data according to the question, keep the source and explain the limits. A map becomes an analysis tool when we know what it represents.
Orbital Nexus calculates where objects in orbit are right now and shows them from where you stand. Humanoid Sim runs the same fall on Earth, on the Moon, and on Mars — the rest is physics, and the trajectory fingerprint is checked between runs. Relieva takes a public elevation model and pulls out of it the slope a delivery actually climbs. Three different objects, the same habit: a public measurement about somewhere else, made to answer a question from here.
Cronberry explores sources and textual context. The bridge with FlowMind follows the link between a topic, a place and the information relevant to the team.